
Google analytics has released a new analytic report that provides insight on the diverse components of an online marketing campaign. “The Customer Journey to Online Purchase” is an interactive tool for brands and marketers. Google analytics breaks it down like this:
“These days, the customer journey has grown more complex. Before making an online purchase decision, a customer may engage with your brand through many different media channels over several days. This tool helps you explore and understand the customer journey to improve your marketing programs.
 These media channels include many that marketers continue to debate each day when determining online strategy. Conversations about organic vs paid listings, or social media sharing vs email will now be judged by a more complete set of facts. Google analytics goes on to say “It’s important to understand the entire customer journey so you can measure all of the elements that contribute to your campaigns, attribute the right value to them, and adjust your marketing budgets where appropriate.”
Google Analytics Customer Journey: Online Buying Behavior
Tens of thousands of Google’s largest advertisers use Multi-Channel Funnels to gain insights each month. This data representing millions of purchases from 11 industries and 7 countries is now aggregated to develop the new benchmarking tool. The Google analytics blog explains the specifics of The Customer Journey to Online Purchase”:
“Purchase paths in this tool are each based on interactions with a single ecommerce advertiser.
You’ll find benchmark data for:
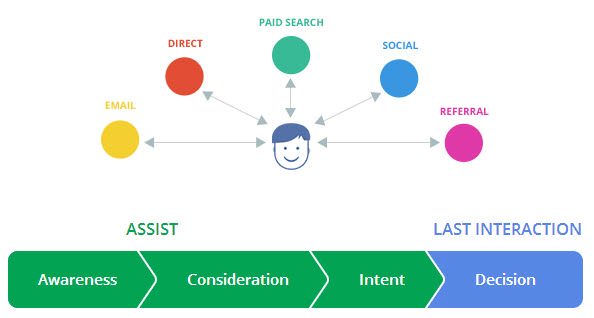
How different marketing channels (such as display, search, email, and your own website) help move users towards purchases. For example, some marketing channels play an “assist” role during the earlier stages of the marketing funnel, whereas some play a “last interaction” role just before a sale.
How long it takes for customers to make a purchase online (from the first time they interact with your marketing to the moment they actually buy something), and how the length of this journey affects average order values.
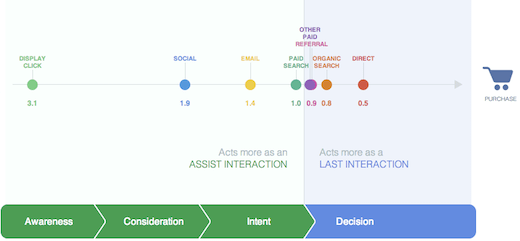
Channel Roles in the Customer Journey
The data shows that every industry is different — the path to purchase for hotel rooms in Japan is not necessarily the same as the path as for an online supermarket in Canada.
A Few Findings Stand Out, in Particular:
As you might expect, customers typically click on display ads early in their purchase journeys, but in some industries, such as US travel and auto, display clicks tend to occur closer to the purchase decision.
Across industries and countries, paid search has a fairly even assist-to-last interaction ratio, implying that this channel can act both in the earlier and later stages of the customer journey.
Advanced Tip:
Once you’ve explored the benchmarks, look deeper into your own marketing data with the Multi-Channel Funnel reports, and consider defining your channels and campaigns to separate out categories that are specific to your business needs.
Purchase Values and the Length of the Journey
We also see interesting patterns emerge when examining the length of the customer journey. While the majority of purchases take place within a single day or a single step (i.e., a single interaction with one marketing channel), longer paths tend to correlate with higher average order values.
For Example:
In US Tech, online purchases that take more than 28 days are worth about 3.5 times more than purchases that occur immediately. And while 61% of tech purchases take place on that first day, only 53% of revenue comes from single-day purchases.
In Consumer Packaged Goods (CPG), on the other hand, most purchases (82%) are quick, likely because these are smaller and simpler purchases that don’t require much research.
In Edu / Gov, 41% of revenue comes from multi-day purchases, but 60% of revenue comes from multi-step purchases — suggesting that even when customers make decisions in a relatively short time period, they often have multiple marketing interactions before purchasing.
Advanced Tip:
In Multi-Channel Funnels or the Attribution Modeling Tool, you can adjust the lookback window to reflect the typical length of the purchase path in your industry. For example, if your business tends to have shorter paths, you can zoom in on paths that take 5 days or less:
Putting the Benchmarks to Work
For marketers, it’s always a crucial challenge to design campaigns that deliver the right message at the right moment in a customer’s journey to purchase. We hope these benchmarks will provide useful insights about the journey and help you put your business into context. In particular, take a look at the final infographic, the “Benchmarks Dashboard,” to get a quick overview of your industry. Then, when you view your own data in the Multi-Channel Funnels reports in Google Analytics, you’ll gain a better understanding of where different channels impact your conversions and what your typical path looks like, so you can adjust your budgeting and marketing programs accordingly.”
Google Analytics Tools
Google Analytics lets you measure your advertising ROI as well as track your various online campaigns. Smart marketers will now take advantage of the newest tool: The Customer Journey to Online Purchase.


